The Furrow Module generates multiple output files that are listed in the Table below.
Table. The list of output files created by the Furrow module.
Output File Name |
Output File Description |
adv.out |
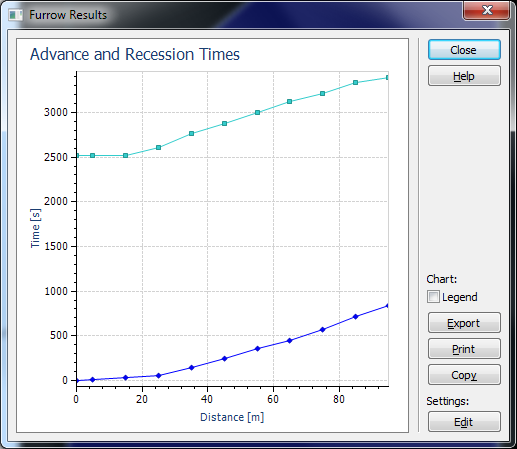
Advance and Recession Times, i.e., times when the advanced and recession fronts arrive at different Stations. |
c.out |
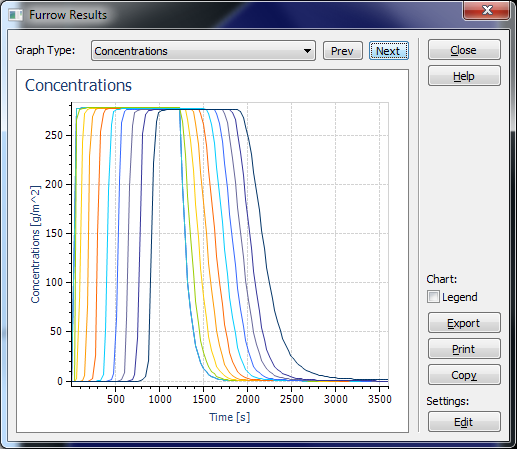
Concentrations at different Stations. The first column is Time [T], the second and further columns are Concentrations at different (N) Stations [L]. |
c_inf.out |
Solute Infiltration Rates [M/L/T] at different Stations versus time. |
Conc1-j.out |
Subsurface spatial distribution of solute Concentrations [M/L3] at Station j at different Time Layers (Print Times). |
h-j.out |
Subsurface spatial distribution of solute Pressure Heads [L] at Station j at different Time Layers (Print Times). |
runoff.out |
Water [L3/T] and Solute [M/T] Runoff from the end of the Furrow. Cumulative Water [L3] and Solute [M] Runoff from the end of the Furrow |
th-j.out |
Subsurface spatial distribution of Water Contents [L3/L3] at Station j at different Time Layers (Print Times). |
w.out |
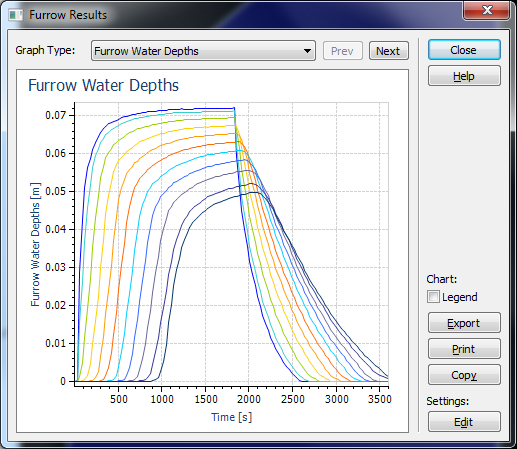
Water Depths at different Stations. The first column is Time [T], the second and further columns are Water Depths at different (N) Stations [L]. |
w_inf.out |
Infiltration Rates [L2/T] at different Stations versus time. |
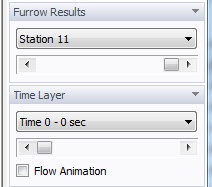
The display of results is divided, similarly as for the standard HYDRUS code into two groups. In the Results section, users can display spatial distributions of Pressure Heads (from the h-j.out output file), Water Contents (th-j.out), and Concentrations (when solute transport is considered; c.out) at different Print Times for different Stations (i.e., locations along the furrow) in the subsurface. This results section thus display the results for the subsurface flow/transport part of the Furrow module. The selection which variable is displayed is made at the Navigator bar. The selection which Station and which Time Layer is displayed is made on the Edit Bar using either a List Box or a Scroll Bar:
In the Results - Other Information section, users can display selected results for the overland flow part of the Furrow Module.
The first set of graphs (Stations) displays Water Depths (the w.out output file), Infiltration Rates (w_inf.out), Cumulative Infiltrations (w_inf.out), Concentrations (c.out), Solute Infiltration Fluxes (c_inf.out), and Cumulative Solute Infiltrations (c_inf.out) at different Stations versus time. This set of graphs corresponds with the standard Observation Points graphs.
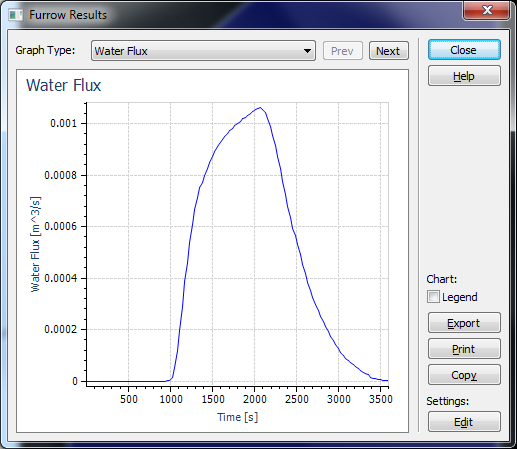
The second set of graphs (Boundary Fluxes) displays Runoff, Cumulative Runoff, Solute Runoff, and Cumulative Solute Runoff at the end of the furrow versus time (the Runoff.out output file).
Finally the last graph displays Advance and Recession Times (the Adv.out output file).