Additional commands on the right side of the graph:
Close |
Closes the dialog windows and returns to the main window of GUI |
Help |
Launches online help for a given dialog window |
Next |
Browses to the next graph of a particular graph sequence |
Previous |
Browses to the previous graph of a particular graph sequence |
Export |
Exports data currently displayed in the x-y graph into an ASCII file |
Export All |
Exports data (even for variables currently not displayed) in the x-y graph into an ASCII file. This command is available only for Cross-Section and Mesh-Line graphs. |
Prints the graph |
|
Default Settings |
Uses default settings for a displayed graph |
Save Settings |
Saves selected settings (thickness of lines, fonts, colors, etc) for a displayed graph into a file ....\Settings\ChartUser.vtc. |
The Following X-Y graphs are available:
Command |
Horizontal Axis |
Vertical Axis |
Observation Points |
Time |
Pressure Head Water Content Temperature Concentration – x+ Sorbed Concentration - x+ |
Pressure Heads |
Time |
Atmospheric Boundary Head Root Zone Head Variable Boundary Head 1 Constant Boundary Head Seepage Face Head Drainage Boundary Head Free and Deep Drainage Boundary Head Variable Boundary Head 2 Variable Boundary Head 3 Variable Boundary Head 4 All Boundaries |
Water Boundary Fluxes |
Time |
Potential Atmospheric Flux Potential Root Water Uptake Rate Actual Atmospheric Flux Actual Root Water Uptake Rate Variable Boundary Flux 1 Constant Boundary Flux Seepage Face Flux Drainage Boundary Flux Free and Deep Drainage Boundary Flux Variable Boundary Flux 2 Variable Boundary Flux 3 Variable Boundary Flux 4 All Atmospheric Fluxes All non-Atmospheric Fluxes Surface Runoff Infiltration Evaporation |
Cumulative Water Boundary Fluxes |
Time |
Potential Atmospheric Flux Potential Root Water Uptake Rate Actual Atmospheric Flux Actual Root Water Uptake Rate Variable Boundary Flux 1 Constant Boundary Flux Seepage Face Flux Drainage Boundary Flux Free and Deep Drainage Boundary Flux Variable Boundary Flux 2 Variable Boundary Flux 3 Variable Boundary Flux 4 All Boundaries Fluxes Surface Runoff Infiltration Evaporation |
Solute Fluxes+ |
Time |
Cumulative Zero-Order Reaction Cumulative First-Order Reaction Cumulative Root Solute Uptake Cumulative Non-Equil. Mass Transfer Cumulative Constant Boundary Solute Flux Cumulative Seepage Face Solute Flux Cumulative Variable Boundary 1 Solute Flux Cumulative Atmospheric Solute Flux Cumulative Drain Boundary Solute Flux Cum. Free/Deep Drainage Bound. Solute FluxCumulative Variable Boundary 2 Solute Flux Cumulative Variable Boundary 3 Solute Flux Cumulative Variable Boundary 4 Solute Flux Constant Boundary Flux Seepage Face Flux Variable Boundary Flux 1 Actual Atmospheric Flux Drain Boundary Flux Free and Deep Drainage Boundary Flux Variable Boundary Flux 2 Variable Boundary Flux 3 Variable Boundary Flux 4 All Solute Cumulative Fluxes All Solute Fluxes |
Soil Hydraulic Properties |
Pressure Head Log Pressure Head Water Content |
Water Content Soil Water Capacity Hydraulic Conductivity Log Hydraulic Conductivity Effective Water Content Pressure Head Log Pressure Head |
Run-Time Information |
Time Step Time |
Time Level Number of Iterations Cumulative Number of Iterations Peclet Number Courant Number Number of Solute Iterations |
+ This graph is given for each solute
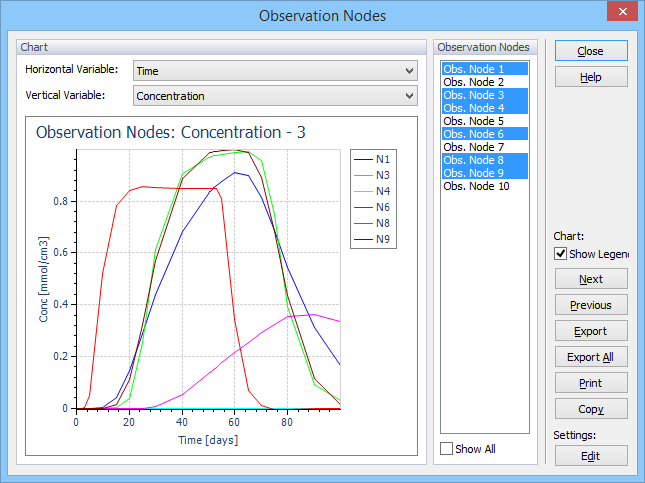
Two list boxes at the top of the x-y graph dialog window provide various combinations of graphs that are possible to display (Table 11 of the User Manual). Browsing through various graphs is additionally also enabled using the Previous and Next command. Double-clicking at various objects of the x-y graph (e.g., axis, title, captions, legend) will allow users to redefine them, i.e., to change their text, colors, or fonts. When the right mouse button is clicked above the graph a pop-up menu will appear that will also allow users to redefine various objects of the x-y graph. One can for example change the text of both vertical and horizontal axis (Axis->Title) captions and titles (Title), their fonts, and colors, one can copy the content of the graph to the clipboard (Copy) for later paste in various other windows applications (e.g., MS Word, PowerPoint, or Excel), or one can change the thickness and colors of displayed lines. Many other modifications of the displayed x-y graph are possible. Data displayed in the x-y graph can be exported into an ASCII file using the Export command. The x-y graph settings can be saved using the Save command.
The x-y graphs have only a limited capacity and can display at most 6,000 data points and 20 lines. If a dataset to be displayed has more data points then allowed, then automatic selection is made by the program (only each n data point is displayed) and a warning (File is too big to be displayed entirely! Automatic selection has been made.) is issued. If the number of observation nodes is larger than 20, only the first 20 observation nodes are displayed.