The Root Water Uptake Parameters for the Threshold Model [Maas, 1990] of the salinity stress response function (multiplicative) (left) are as follows:
Threshold |
Value of the minimum osmotic head [L] (the salinity threshold) above which root water uptake occurs without a reduction. |
Slope |
Slope of the curve determining the fractional root water uptake decline per unit increase in salinity below the threshold. |
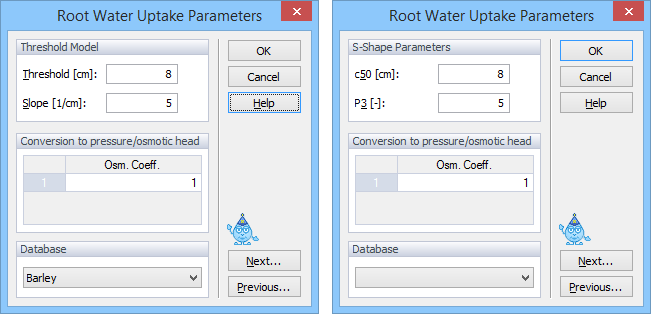
The drop-down database for the threshold model provides suggested values based on the ECe in dS/m. These must be converted to osmotic pressure in the head units [L] or concentration units used in your project. For guidance, see Eqs. 13.3 and 13.4 in Maas [1990]. Enter threshold [L or M/L3] and the the slope [fractional yield decrease per L].
The Root Water Uptake Parameters for the S-Shaped Model [van Genuchten, 1987] of the salinity stress response function (multiplicative) (right) are as follows:
P3 |
The exponent, p3, in the root water uptake response function associated with salinity stress [-]. The recommended value is 3. |
c50 |
The coefficient, h50, in the root water uptake response function associated with salinity stress [L]. Root water uptake at this osmotic head is reduced by 50%. |
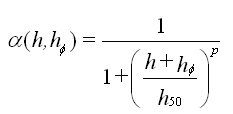
Both salinity stress response functions require a coefficient (Osmotic Coefficient) that transforms concentrations into equivalent osmotic pressure heads. The osmotic coefficients should be negative for the additive model (to be added to negative pressure heads) and positive for the multiplicative model.
Note that this conversion needs to be made mainly when one uses the Additive Model. That is because then one needs to add pressure heads (i.e., units of m or cm) and osmotic heads (calculated from concentrations, which likely have units of dS/m). If one uses the Multiplicative Model then one does not need to use this conversion, and can keep Osm. Coeff equal to one, since a) both water stress and salinity stress response functions can have their own units, and b) both the Threshold Model parameters (specified above) and selected concentrations units are likely already the same (e.g., units of EC (dS/m)).
A database of suggested values for different plants for the threshold-slope salinity stress model is provided based on the work by Maas [1990]. The database for the threshold model provides suggested values based on the electric conductivity of the saturation extract ECe in dS/m. These values are converted internally in the GUI into the electric conductivity of soil water (at the field capacity) as follows: ECw ≈ ke * ECe, where ke is approximately 2 [Skaggs et al., 2006]. Consequently, the threshold value of Maas [1990] is multiplied by 2 (ke) and the slope is divided by 2.
When the S-Shape model, rather than the Threshold and Slope model, is used, the same database of Mass [1990] is used and the c50 coefficient (with 50% root water uptake reduction) is evaluated as follows: c50 = 50/s + cT.
A user is responsible for converting these values in the regular HYDRUS further to the osmotic pressure in the head units [L] or concentration units used in your project. For guidance, see Eqs. 13.3 and 13.4 in Maas [1990].
Enter threshold [L or M/L3] and the absolute (UNSATCHEM) or percentage (HYDRUS) value of the slope [fractional yield decrease per L]. Osmotic coefficients are not used in the UNSATCHEM model.
The threshold-slope salinity stress model is implemented in the standard HYDRUS solute transport model as follows:
while in the Unsatchem module as:
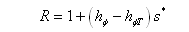
where
cT – threshold (in concentrations)
hϕT – threshold (in osmotic head)
s – slope (in HYDRUS)
s* – slope (in Unsatchem).
In one of our application we have found the following relationship between the osmotic head hf and the electric conductivity ECw:
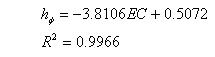
This relationship can be used to convert the ECw [dS/m] (obtained as described above from the ECe values given in the Maas [1990] database) to hf [m]. U.S. Salinity Laboratory Staff (1954) reported the following relationship (when converted to S.I. units) for estimating the osmotic pressure of soil solutions from ECw measurements: hf = -3.7188 ECw.
Skaggs, T. H., P. J. Shouse, and J. A. Poss, Irrigating Forage Crops with Saline Waters. 2. Modeling Root Uptake and Drainage, Vadose Zone J., 5, 824-837, 2006.
U.S. Salinity Laboratory Staff, Diagnosis and Improvement of Saline and Alcaly Soils, USDA Handbook 60, Washington, USA, 1954.
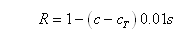
Different sensitivity of the root water uptake to water and salinity stresses
The S-shape function given above can be used to consider different sensitivities to water and salinity stresses as follows
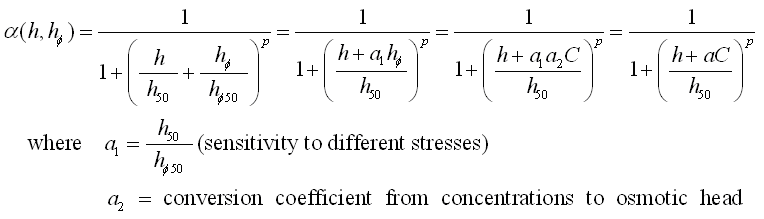
The osmotic coefficient can then be used to account for both the conversion of solute concentrations to osmotic head, as well as for different sensitivity of root water uptake to different stresses. The coefficient a can also be defined directly as h50/c50 (a=a1a2=h50/hϕ50 hϕ50/c50=h50/c50).
Other Root Water Uptake and Growth Topics
Pressure Head Reduction - the Feddes Model
Pressure Head Reduction - the S-Shaped Model