Parameters for the soil hydraulic models are specified in the Water Flow Parameters dialog window.
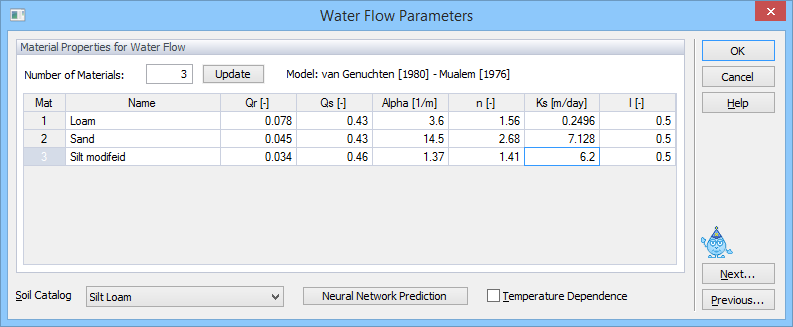
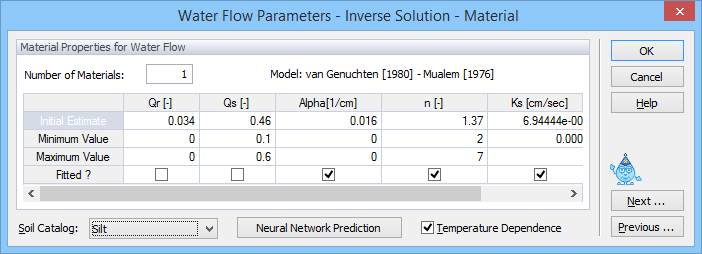
The Water Flow Parameters dialog window for direct (top) and inverse (bottom) problems.
The unsaturated soil hydraulic properties in the HYDRUS code are described with a set of closed-form equations resembling those of van Genuchten [1980] who used the statistical pore-size distribution model of Mualem [1976] to obtain a predictive equation for the unsaturated hydraulic conductivity function. The original van Genuchten equations may be modified to add extra flexibility in the description of the hydraulic properties near saturation [Vogel and Cislerova, 1988]. Users can also select models suggested by Brooks and Corey [1964], Kosugi [1996], and Durner [1994].
In all models (i.e., Brooks and Corey, 1964; van Genuchten, 1980; Vogel and Cislerova, 1988; Kosugi, 1996, and Durner, 1994), θr (Qr) and θs (Qs) denote the residual and saturated water contents, respectively; Ks (Ks) [LT-1] is the saturated hydraulic conductivity, and l is a pore-connectivity parameter. The parameters α (Alpha) [L-1] and n [-] are empirical coefficients affecting the shape of the hydraulic functions.
The modified van Genuchten model has four additional parameters: θa (Qa) – a water content smaller or equal to θr, θm (Qm) – a water content larger or equal to θs, Kk (Kk) [LT-1] – the unsaturated hydraulic conductivity at water content θk, and θk (Qk) – the water content associated with Kk.
Durner’s [1994] model has three additional parameters: w2 (w2), α2 (Alpha2) [L-1], and n2 (n2), where w2 is the weighting factor for the second overlapping region, and α2 and n2 are empirical parameters for the second region.
The hysteretic model has also three additional parameters: θsw (QsW) – the saturated water content of the main wetting branch, αw (AlphaW) [L-1] – the shape parameter of the main wetting branch, and Ksw (KsW) [LT-1] - the saturated hydraulic conductivity associated with the main wetting branch (in case hysteresis also occurs in the conductivity function).
Qr |
Residual soil water content, θr |
Qs |
Saturated soil water content, θs |
Alpha |
Parameter α in the soil water retention function [L-1] |
n |
Parameter n in the soil water retention function |
Ks |
Saturated hydraulic conductivity, Ks [LT-1] |
l |
Tortuosity parameter in the conductivity function [-] |
When the modified van Genuchten model is used [Vogel and Cislerova, 1988]:
Qa |
Parameter θa in the soil water retention function |
Qm |
Parameter θm in the soil water retention function |
Kk |
Measured value of the hydraulic conductivity, Kk , corresponding to θk [LT-1] |
Qk |
Soil water content, θk , corresponding to Kk |
When Durner’s [1994] model is used:
w |
Parameter w for material M [-]. Relative weighting factor for the subcurve for the second overlapping subregion. |
Alpha2 |
Parameter α for material M [L-1], for the second overlapping subregion. |
n2 |
Parameter n for material M [-], for the second overlapping subregion. |
When the dual-porosity models is used with mass transfer driven by the water content gradient:
QrIm |
Parameter θr for the immobile region of material M. |
QsIm |
Parameter θs for the immobile region of material M. |
Omega |
Parameter ω (mass transfer coefficient) for material M [T-1]. |
When the dual-porosity models is used with mass transfer driven by the pressure head gradient:
QrIm |
Parameter θr for the immobile region of material M. |
QsIm |
Parameter θs for the immobile region of material M. |
AlphaI |
Parameter α for the immobile region of material M [L-1] |
nI |
Parameter n for the immobile region of material M |
Omega |
Parameter ω (mass transfer coefficient) for material M [T-1]. |
When the dual-permeability model is used:
Qr |
Residual soil water content of the matrix, θr |
Qs |
Saturated soil water content of the matrix, θs |
Alpha |
Parameter α in the soil water retention function of the matrix [L-1] |
n |
Parameter n in the soil water retention function of the matrix [-] |
Ks |
Saturated hydraulic conductivity of the matrix, Ks [LT-1] |
l |
Tortuosity parameter in the conductivity function of the matrix [-] |
QrFr |
Residual soil water content of the fracture domain, θr |
QsFr |
Saturated soil water content of the fracture domain, θs |
AlphaFr |
Parameter α in the soil water retention function of the fracture domain [L-1] |
nFr |
Parameter n in the soil water retention function of the fracture domain [-] |
KsFr |
Saturated hydraulic conductivity of the fracture domain, Ks [LT-1] |
lFr |
Tortuosity parameter in the conductivity function of the fracture domain [-] |
w |
Ratio of the volumes of the macropore or fracture domain and the total soil system, w [-]. Must be the same for all soil layers. |
Beta |
Shape factor that depends on the geometry, β [-]; it is 3 for rectangular slabs. |
Gamma |
Scaling factor (=0.4) |
a |
Effective ‘diffusion’ pathlength (i.e. half the aggregate width or half the fracture spacing), d [L] |
Ksa |
Saturated hydraulic conductivity Kas [LT-1] of the fracture-matrix interface) |
Temperature Dependence:
Check this box if the hydraulic properties are considered to be temperature dependent. Using capillary theory, the influence of temperature on the soil water pressure head is then quantitatively predicted from the influence of temperature on surface tension, while the influence of temperature on the hydraulic conductivity is predicted from the influence of temperature on viscosity and the density of water.
Soil Catalog:
The hydraulic parameters of selected soils were included into a catalog from which users can make selections. The van Genuchten parameters were taken from Carsel and Parrish [1988], the Brooks and Corey parameters are from Rawls et al. [1982]. Rawls et al. (1982) used multiple linear regression to estimate the Brooks and Corey parameters from a large database of some 2540 soil horizons. Their regression equations were subsequently used also by Carsel and Parrish [1988], but the results were further manipulated statistically to get van Genuchten parameters probability density functions (superficially, the van Genuchten parameters are the same or closely related to the BC parameters, such as n=lambda+1). Hence the Carsel and Parrish ([1988] parameters were statistically derived from the Rawls et al. [1982] estimates; they were not fitted independently to the Rawls database. Some caution is needed when using these parameter values since they only represent very approximate averages for different textural classes. The soil hydraulic parameters in the catalog for the Kosugi’s model were obtained by fitting retention curves generated using the Carsel and Parrish [1988] parameters for the van Genuchten’s [1980] model using RETC.
The following soil textural classes are represented in the soil hydraulic catalog:
Sand
Loamy Sand
Sandy Loam
Loam
Silt Loam
Sandy Clay Loam
Clay Loam
Silty Clay Loam
Sandy Clay
Silty Clay
Clay
The program uses pedotransfer functions (PTFs) based on neural networks [Schaap et al., 2001] to predict van Genuchten’s [1980] water retention parameters and the saturated hydraulic conductivity (Ks) based on textural information.
When the parameter estimation option is selected, then users have to provide initial estimates of the optimized soil hydraulic parameters, specify which parameters are to be optimized (check appropriate checkboxes), and provide parameter constraints for the optimization. Entering zeros (the default values) for the minimum and maximum values signifies that the parameters are unconstrained.
Soil hydraulic parameters for the analytical functions of van Genuchten [1980] for twelve textural classes of the USDA soil textural triangle according to Carsel and Parrish [1988].
Textural class |
θr |
θs |
α |
n |
Ks |
[L3L-3] |
[L3L-3] |
[cm-1] |
[-] |
[cm d-1] |
|
Sand |
0.045 |
0.43 |
0.145 |
2.68 |
712.8 |
Loamy Sand |
0.057 |
0.41 |
0.124 |
2.28 |
350.2 |
Sandy Loam |
0.065 |
0.41 |
0.075 |
1.89 |
106.1 |
Loam |
0.078 |
0.43 |
0.036 |
1.56 |
24.96 |
Silt |
0.034 |
0.46 |
0.016 |
1.37 |
6.00 |
Silty Loam |
0.067 |
0.45 |
0.020 |
1.41 |
10.8 |
Sandy Clay Loam |
0.100 |
0.39 |
0.059 |
1.48 |
31.44 |
Clay Loam |
0.095 |
0.41 |
0.019 |
1.31 |
6.24 |
Silty Clay Loam |
0.089 |
0.43 |
0.010 |
1.23 |
1.68 |
Sandy Clay |
0.100 |
0.38 |
0.027 |
1.23 |
2.88 |
Silty Clay |
0.070 |
0.36 |
0.005 |
1.09 |
0.48 |
Clay |
0.068 |
0.38 |
0.008 |
1.09 |
4.80 |
Soil hydraulic parameters for the analytical functions of van Genuchten [1980] for twelve textural classes of the USDA textural triangle as obtained with the Rosetta Lite program [Schaap et al., 2001].
Textural class |
θr |
θs |
α |
n |
Ks |
[L3L-3] |
[L3L-3] |
[cm-1] |
[-] |
[cm d-1] |
|
Sand |
0.053 |
0.375 |
0.035 |
3.18 |
643 |
Loamy Sand |
0.049 |
0.39 |
0.035 |
1.75 |
105 |
Sandy Loam |
0.039 |
0.387 |
0.027 |
1.45 |
38.2 |
Loam |
0.061 |
0.399 |
0.011 |
1.47 |
12.0 |
Silt |
0.050 |
0.489 |
0.007 |
1.68 |
43.7 |
Silty Loam |
0.065 |
0.439 |
0.005 |
1.66 |
18.3 |
Sandy Clay Loam |
0.063 |
0.384 |
0.021 |
1.33 |
13.2 |
Clay Loam |
0.079 |
0.442 |
0.016 |
1.41 |
8.18 |
Silty Clay Loam |
0.090 |
0.482 |
0.008 |
1.52 |
11.1 |
Sandy Clay |
0.117 |
0.385 |
0.033 |
1.21 |
11.4 |
Silty Clay |
0.111 |
0.481 |
0.016 |
1.32 |
9.61 |
Clay |
0.098 |
0.459 |
0.015 |
1.25 |
14.8 |
Soil hydraulic parameters for the analytical functions of Brooks and Corey [1964] for twelve textural classes of the USDA soil textural triangle according to Rawls et al. [1982].
Textural class |
θr |
θs |
α |
n |
Ks |
[L3L-3] |
[L3L-3] |
[cm-1] |
[-] |
[cm d-1] |
|
Sand |
0.020 |
0.417 |
0.138 |
0.592 |
504 |
Loamy Sand |
0.035 |
0.401 |
0.115 |
0.474 |
146.6 |
Sandy Loam |
0.041 |
0.412 |
0.0682 |
0.322 |
62.2 |
Loam |
0.027 |
0.434 |
0.0897 |
0.220 |
31.7 |
Silt |
0.015 |
0.486 |
0.0482 |
0.211 |
16.3 |
Silty Loam |
0.015 |
0.486 |
0.0482 |
0.211 |
16.3 |
Sandy Clay Loam |
0.068 |
0.330 |
0.0356 |
0.250 |
10.3 |
Clay Loam |
0.075 |
0.390 |
0.0386 |
0.194 |
5.52 |
Silty Clay Loam |
0.040 |
0.432 |
0.0307 |
0.151 |
3.60 |
Sandy Clay |
0.109 |
0.321 |
0.0343 |
0.168 |
2.88 |
Silty Clay |
0.056 |
0.423 |
0.0292 |
0.127 |
2.16 |
Clay |
0.090 |
0.385 |
0.0268 |
0.131 |
1.44 |
Soil hydraulic parameters for the analytical functions of Kosugi [1996] for twelve textural classes of the USDA soil textural triangle.
Textural class |
θr |
θs |
α |
n |
Ks |
[L3L-3] |
[L3L-3] |
[cm-1] |
[-] |
[cm d-1] |
|
Sand |
0.045 |
0.43 |
303.7 |
0.383 |
712.8 |
Loamy Sand |
0.057 |
0.41 |
12.47 |
0.95 |
350.2 |
Sandy Loam |
0.065 |
0.41 |
27.42 |
1.26 |
106.1 |
Loam |
0.078 |
0.43 |
101.8 |
1.80 |
24.96 |
Silt |
0.034 |
0.46 |
510.6 |
2.48 |
6.0 |
Silty Loam |
0.067 |
0.45 |
325.9 |
2.30 |
10.8 |
Sandy Clay Loam |
0.100 |
0.39 |
80.89 |
2.04 |
31.44 |
Clay Loam |
0.095 |
0.41 |
666.3 |
2.81 |
6.24 |
Silty Clay Loam |
0.089 |
0.43 |
2853 |
3.26 |
1.68 |
Sandy Clay |
0.100 |
0.38 |
1129 |
3.41 |
2.88 |
Silty Clay |
0.070 |
0.36 |
140538 |
4.49 |
0.48 |
Clay |
0.068 |
0.38 |
103815 |
4.67 |
4.80 |
Note that in Version 2, each material can have a name (e.g., Material 1, Sand, Clay). When soil hydraulic parameters are assigned using the Soil Catalog, the names of textural classes will appear in the Name column. These names will then appear throughout the HYDRUS GUI, e.g., at the Edit Bar or in the Sort Property Object window.
The parameter l in the hydraulic conductivity function represents the effects of tortuosity and pore connectivity. Whereas its value was initially estimated to be 0.5 by Mualem [1976], there is no general agreement on this. Marcel Schaap, for example, after analyzing the UNSODA database, suggests that this parameter should have a value of -1.
Since all shape parameters (a and n) of the hydraulic conductivity function come directly from the retention curve, one can not influence independently the shape of the hydraulic conductivity function. One can only scale it using the saturated hydraulic conductivity Ks. However, by introducing the parameter l, one has a) the opportunity to influence the shape of K(h), and b) one more degree of freedom during the optimization, which is useful for well-defined experimental data, such as those obtained with multistep outflow and evaporation methods.
Note that in Version 2, each material have a name (e.g., Material 1, Sand, Clay). When soil hydraulic parameters are assigned using the Soil Catalog, the names of textural classes will appear in the Name column. These names then appear throughout the HYDRUS GUI, e.g., at the Edit Bar or in the Sort Property Object window.
C-15-A concrete: a mix of cement, calcium carbonate, sand, calcareous aggregates and superplasticizer
M1 mortar: a mix of cement, silica fume, limestone and superplasticizer
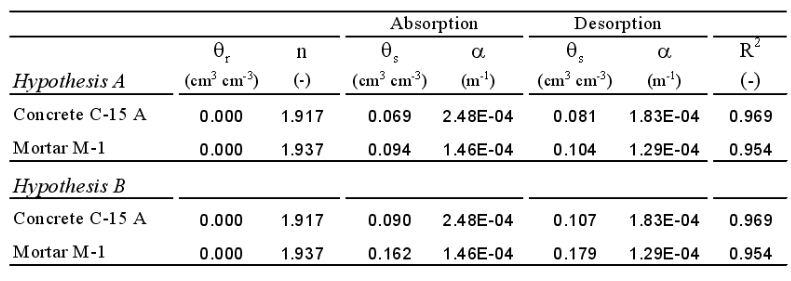
Table: van Genuchten parameters for a hysteresis model with a single n parameter.
The saturated hydraulic conductivity, Ks, was optimized (using inverse modeling) to 5.67×10⁻¹³ m/s and 5.87×10⁻¹⁴ m/s for the C-15-A concrete and the M1 mortar, respectively, significantly lower values than those found experimentally (4.58×10⁻¹¹ m s-1 and 2.33×10⁻¹¹ m s-1, respectively).
Schneider, S. D. Jacques, and D. Mallants, Estimating unsaturated hydraulic properties of concrete C-15-A and mortar M1, Restricted Contract Report SCK*CEN-R-5051, 10/SSc/P-57, 2010.