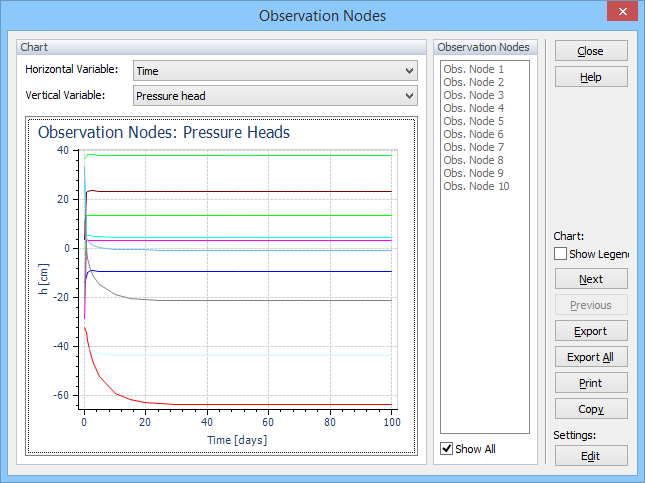
Graphical representation of changes in water content, pressure head, temperature and/or concentration at specified observation nodes. Observation nodes must be specified before the calculations. Variables can be displayed either for all (Show All) or selected observation nodes.
See the X-Y Graph topic for more information on this graph.
Return to Results Menu.