The Navigator Bar (sections Results - Graphical Display and Results - Other Information) and the Results Menu provide a quick access to various types of displays of the output results.
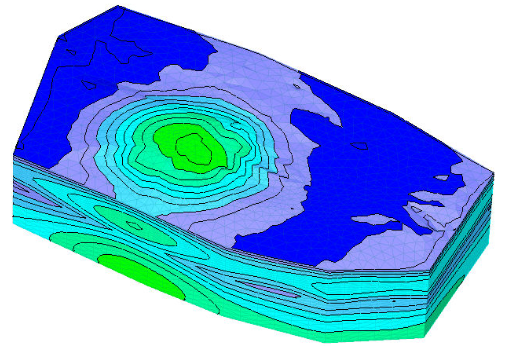
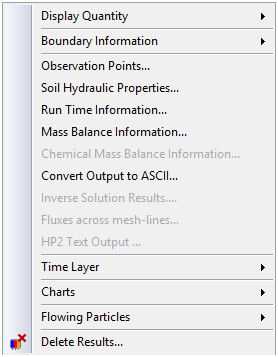
Commands from the Results - Graphical Display section of the Navigator Bar or the Display Quantity submenu of the Results Menu display a spatial distribution of output variables (e.g., Pressure Heads, Water Contents, Velocities, Concentrations, and Temperatures) for a particular project. These variables can be displayed by means of Spectral maps, Isolines, Color Points, Color Edges, and Isosurfaces, or by Animation of both the spectral maps, isolines, and isosurfaces.
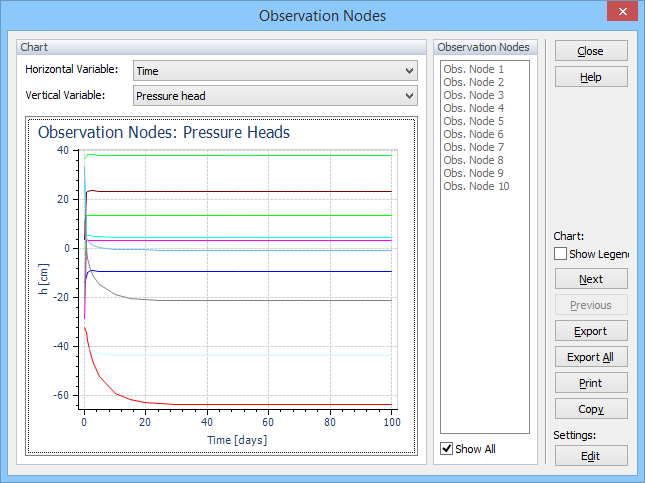
Commands from the Results - Other Information section of the Navigator Bar or the Boundary Information submenu of the Results Menu display various other graphs, such as selected variables at observation nodes, boundary fluxes or run-time information.
Command |
Brief Description |
Selects a variable to be displayed Liquid Concentrations (Wetlands Module) Adsorbed Concentrations (Wetlands Module) See the complete list of Standard and Alternative Variables listed in the tables below. |
|
Displays results for a particular boundary |
|
Displays a selected variable at observation nodes |
|
Displays soil hydraulic functions |
|
Displays Run-Time Information |
|
Displays Mass Balance Information |
|
Displays Mass Balance Information for the UnsatChem module |
|
Converts Output Binary Files into ASCI files |
|
Displays Inverse Solution Results |
|
Displays water and solute fluxes across mesh-lines |
|
Displays output files for the HP2 Module |
|
Displays selected time layer |
|
Displays charts for a selected line |
|
Displays charts for a selected line |
|
Deletes Output Results |
See the X-Y Graph topic for more information on commands available in graphs.
Standard variables displayed in the View Window of the Results tab (Results - Graphical Display).
Variable |
Description |
Pressure Head |
Pressure head h [L]; displayed always |
Water Content |
Water content θ [-]; displayed always |
Velocity |
Values of the Darcy's flux q [L/T]; displayed always |
Velocity Vectors |
Darcy's flux vectors q [L/T]; displayed always |
Root Water Uptake |
Root water uptake S [1/T]; displayed when root water uptake is considered |
Concentration i |
Liquid phase concentration c [Mc/Lw3]; displayed when solute transport in the standard module is simulated. |
Sorbed Noneq. Conc. i |
Concentration of kinetically sorbed solute sk [Mc/Ms]+; displayed when solute transport in the standard module is simulated and when the two-site sorption model is considered. |
Immobile Conc. i |
Concentration in the immobile water cim [Mc/Lw3]; displayed when solute transport in the standard module is simulated and mobile-immobile water or dual-porosity models are considered. |
Temperature |
Temperature T [oC]; displayed when heat transport is simulated. |
Unsatchem Variables |
Major ions (Ca, Mg, Na, K, HCO3, SO4, Cl, tracer, sorbed Ca, sorbed Mg, sorbed Na, sorbed K, calcite, gypsum, dolomite, nesquohonite, hydromagnesite, sepiolite; displayed when the Unsatchem module is used. |
Wetland Variables |
Various variables used in the two constructed wetlands modules CW2D and CWM1 (see the Wetlands module manual for details). |
Subscripts c, s, and w refer to contaminant, soil, and water.
Alternative variables that can be displayed in the View Window of the Results tab.
Back to HYDRUS Step by Step.