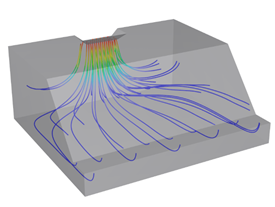
Displays the Streamlines for a given steady-flow velocity field. Streamlines are one of the most commonly used graphical representations of CFD results and display very clearly the flow direction.
Streamlines are evaluated from the flow field at the given time step and do not take into account possible non-stationary flow, i.e., the particle trajectory calculated in this way may not match the particle trajectory for non-stationary flow (the calculation of particle trajectories in 3D problems is also one of the new options in version 3). If the flow is steady of changes only slightly, the streamlines are identical to the trajectories of the particles. The calculation of streamlines is always done from so-called "seed points" that can be generated in different ways. Default seed points are placed in nodes of the FE Mesh where the flow rate is maximum. However, the user can place seed points at any point in the area - see, for example, seed points generated on the rectangle in the enclosed video. The display of streamlines has many options for user settings and it is also possible to display animation of particles moving along computed streamlines.
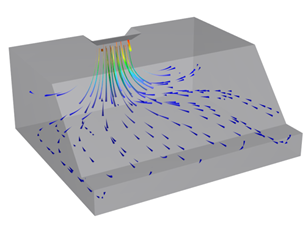
There also is an option to run a flow animation, i.e. the movement of particles along streamlines. Users can save this animation as a video file and use it for a presentation of HYDRUS results.
The basic Streamlines features are shown in the video tutorial Streamlines .