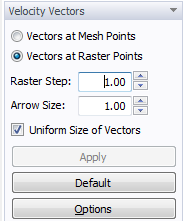
Displays a water flow velocities (Darcian fluid flux densities) by means of vectors.
Velocity vectors can be located at each Mesh Point (Vectors at Mesh Points) or at Raster Points (Vectors at Raster Points). The distance between Raster Points is set using Raster Step.
This is not particularly suitable to display velocity vectors at Mesh Points in 3D problems, in which the finite element mesh often has hundreds of thousands of nodes. Then, the display of the velocity field is unclear and slow. The new version of HYDRUS 3.x has therefore a new option to display the velocity vectors at regular grid points = at raster point, the density of which can be chosen by the user at their discretion. The raster can also be used on the Slicer planes.
All velocity vectors may be enlarged or reduced by using an Arrow Size on the Edit Bar.
Using of this new method are shown in the video tutorial Velocity vectors in raster points .
The number of colors in the color spectrum can be selected using the Edit Color Scale and Isobands window.
The entire finite element mesh, boundary nodes, and the numbering of nodes, elements and/or edges, can be displayed, together with the velocity vector plot (see View Tab of the Navigator Bar). The desired display option can be selected using the Display Options window.
Users may zoom into a certain part of the transport domain. Also, the entire transport domain can be enlarged or reduced, among other features (see View Menu commands).