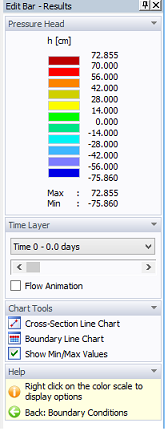
The Edit Bar for Results displays, similarly as for the initial conditions, a spectrum that is used to show results, and the minimum and maximum values for the entire domain. This bar further includes:
- A Time Layer command to specify which time layers (corresponding to print times specified in the Output Information dialog window) are to be displayed. Time layers can be chosen either from the list box, or from a scroll bar. It is also possible to perform animation of results by clicking on the Flow Animation check box.
- Two Chart Tools commands (Cross-Section Chart and Boundary-Line Chart), which have the same purpose as for the initial condition. The last command (i.e., Display Values at Nodes) causes the value of a particular variable (e.g., water content) of the node closest to the cursor do be displayed.
- The Help command. One useful feature of the Help command here is the Right click on the Color Scale display options (a right-click displays the Edit Isoband Values and Color Spectra dialog window). Right-clicking results in the display of the pop-up menu that allows users to choose different display options, such as Color Smoothing, and Isolines.