The Edit Color Scale and Isobands dialog window (called by left-clicking the color scale display options of the Results version of the Edit Bar or from the menu) allows users to define colors for display of isobands and color spectra, and values of particular isolines. The default scale has always 11 values, which corresponds to 11 colors for color contours and 12 colors for isolines. Values at the scale are calculated by evenly dividing the interval between the minimum and maximum of a particular variable. Numbers are formatted depending on units used to display a particular variable. When the number of displayed digits is insufficient, it is possible to use a scientific format (E-format). The E-format is then used also on the Edit Bar and for printing (only for a particular variable).
Note that switching from a regular format to the E-format represents also switching from the Standard Scale to the Custom Scale (see below), which is then kept for the display of the same variable at other times. Returning to the Standard Scale may be required to adjust the scale as needed to display a given variable at the new time.
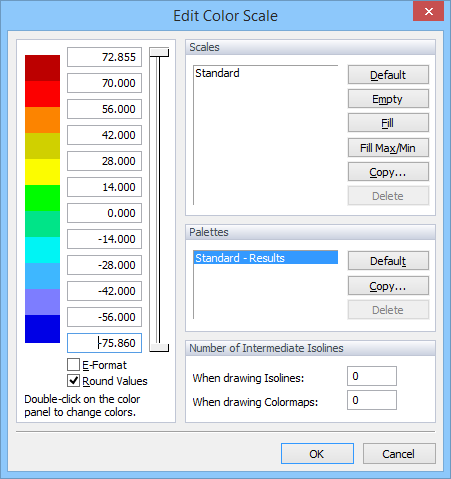
Users can also define the Isoline scales. This can be done by simply changing numbers in the edit boxes next to the colors. If the numbers are not in an increasing or decreasing order, a warning will be issued. Newly created Isoline scales can be saved (Save Scale) (again locally or globally) and used later. Users need to specify only the maximum and minimum values (the top and bottom edit boxes); after clicking the Fill command; the program will calculate and fill (complete) the intermediate numbers by interpolation.
Minimum and maximum numbers of the scale are automatically adjusted to a particular problem and for a particular variable. By default, HYDRUS searches all output time levels of a particular project for the minimum and maximum values of a particular variable, and then leaves the scale invariant in time between these two values. The scale, however, can also be automatically adjusted for each time level by specifying the minimum and maximum values for a particular variable and a particular print time when the option Min/Max Global in Time from the Color Scale View Options of the View Tab of the Navigator Bar is unselected. Similarly, the scale can be automatically adjusted for a particular layer of the FE-mesh (a section) (the minimum and maximum values of a particular variable and for a particular section) when the option Min/Max Global in Space from the Color Scale View Options of the View Tab of the Navigator Bar is unselected.
A specified number of Intermediate Isolines can be drawn between the main isolines using When drawing Isolines or When drawing Color Contours.
A user can define his/her own scale that is then remembered by the software and used for a particular variable in a given project. When one wants to use a certain scale also in other projects, he/she needs to save it using the Save command.
Other commands:
The number of values at the Scale can not be increased, it can only be lowered (from 11) using a "slider". By drawing a slider, one can also generate values at a Scale (see the figure below):

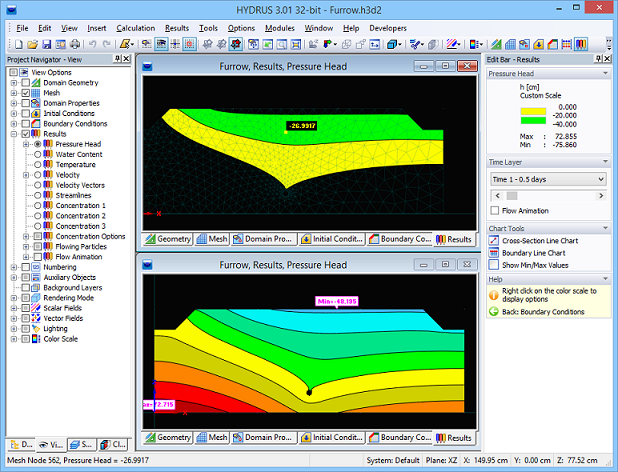
When using a Custom Scale, the actual minimum or maximum of a displayed variable can be outside of the interval of the scale. Values outside of the interval of the scale are not displayed in the View window, resulting in empty spaces as shown in the upper part of the figure below.
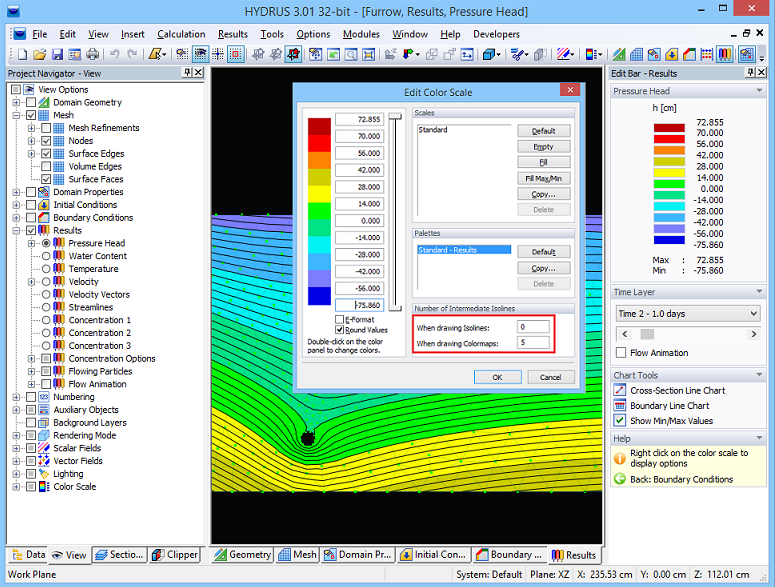
A specified Number of Intermediate Isolines can be drawn between the main isolines using When drawing Isolines or When drawing Color Contours. This number is by default equal to zero. Five intermediate isolines are used in the figure below.
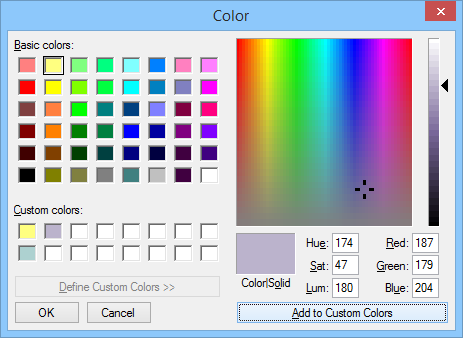
After clicking on the color panel with the left mouse button, the Color dialog window appears (shown below), in which one can redefine colors to be used in displays. By default a Standard Palette is used. If a Custom Scale exists for a displayed variable, colors for this scale will be displayed even when Standard Scale was currently used (since the Standard Scale can not be edited). Palettes with newly defined colors can be saved (Save Palette) under a new name and used for different purposes. The new palette can be saved locally and used with the given application, or globally and used for all HYDRUS applications. Users hence can in this way define different palettes for displaying water contents, pressure heads, concentrations, or temperatures. Since the Standard Palette can not be changed, once any color is changed, the program will request to save a new scale under a new name. The changed colors will be used for all displayed variables (not only the actual one).
A right mouse button click on the Color Scale at the Edit Bar displays the menu for a fast change of various options related to scale.