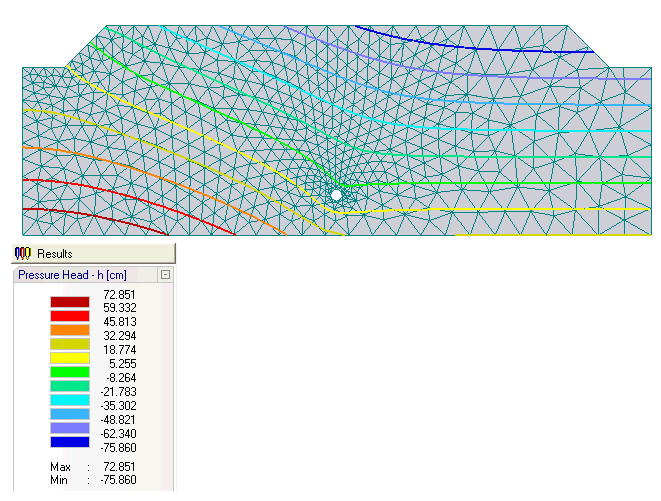
This command displays the spatial distribution of a certain variable by means of isolines.
The isolines use the entire color spectrum. The color mode or the increments between isolines can be modified using the Edit Color Scale and Isobands command. The default increment of isolines depends on the type of variable being selected.
The entire finite element mesh, boundary nodes, and the numbering of nodes, elements and/or edges, can be displayed, together with the isoline graph (see View Tab of the Navigator Bar). The particular display option can be selected using the Display Options window.
Users may zoom into a certain part of the transport domain. Also, the entire transport domain can be enlarged or reduced, among other features (see View Menu commands).
Return to Options Menu.