The past several decades or so has seen an explosion of increasingly sophisticated numerical models for simulating water flow and contaminant transport in the subsurface, including models dealing with one- and multi-dimensional flow and transport processes in the unsaturated or vadose zone between the soil surface and the ground water table. Even with an abundance of well-documented models now available, one major problem often preventing their optimal use is the extensive work required for data preparation, numerical grid design, and graphical presentation of the output results. Hence, the more widespread use of multi-dimensional models requires ways which make it easier to create, manipulate and display large data files, and which facilitate interactive data management. Introducing such techniques will free users from cumbersome manual data processing, and should enhance the efficiency in which programs are being implemented for a particular example. To avoid or simplify the preparation and management of relatively complex input data files for two- and three-dimensional applications, and to graphically display the final simulation results, we developed an interactive graphics-based user-friendly interface HYDRUS for the MS Windows 95, 98, NT, ME, XP, 7, and 10 environments. The interface is connected directly to the computational codes. The previous version 1.0 of the HYDRUS graphical user interface represented a complete rewrite of the version 2.0 of HYDRUS-2D, and expanded its capabilities to three-dimensional problems. The current version 3.0 significantly further expands capabilities of version 1.0 (see New Features in Version 2.0) and version 2.0 (New Features in Version 3.0). Throughout this user manual we will use alternatively the name HYDRUS for this interface as well as for the separate computational codes.
In addition to information given in this user manual, extensive context-sensitive on-line help is made part of the graphical user interface (GUI). By holding the F1 button or clicking on the Help button while working in any window, user can obtain information about the window content. In addition, context-sensitive help is available in every module using the "SHIFT+F1" help button. In this mode, the mouse cursor changes to a help cursor (a combination arrow + question mark), which a user can use to select a particular object for which help is needed (e.g., a menu item, toolbar button, or other feature). At that point a help file will be displayed giving information about the item on which the user clicked. Except for the computational modules that are written in FORTRAN, the entire GUI is written in C++.
The HYDRUS Graphical User Interface is the main program unit defining the overall computational environment of the system. This main module controls execution of the program and determines which other optional modules are necessary for a particular application. The module contains a project manager and both the pre-processing and post-processing units. The pre-processing unit includes specification of all necessary parameters to successfully run the HYDRUS FORTRAN codes (modules H2D_CALC, H2D_CLCI, H2D_WETL, H2D_UNSC, and/or H3D_CALC), grid generators for relatively simple rectangular and hexahedral transport domains, a grid generator for unstructured finite element meshes appropriate for more complex two-dimensional and three-dimensional domains, a small catalog of soil hydraulic properties, and a Rosetta Lite program for generating soil hydraulic properties from textural information. The post-processing unit consists of simple x-y graphs for graphical presentation of the soil hydraulic properties, distributions versus time of a particular variable at selected observation points, as well as actual or cumulative water and solute fluxes across boundaries of a particular type. The post-processing unit also includes options to present results of a simulation by means of contour maps, isolines, isosurfaces, spectral maps, and velocity vectors, and/or by animation using both contour and spectral maps.
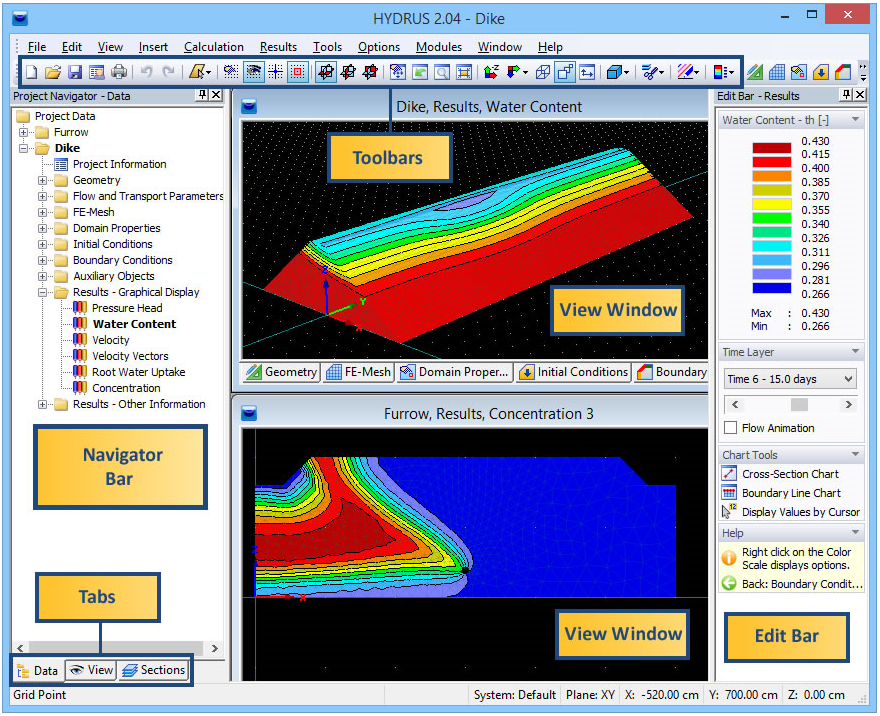
This figure shows the main window of the HYDRUS graphical user interface, including its main components such as the Menus, the Toolbars, the View Window, the Navigator Bar, Tabs, and the Edit Bar. These terms will be used throughout this online help. The text below provides a detailed description of all major components of the graphical user interface.
Work for a new project should begin by opening the Project Manager, and giving a name and brief description to the new project. Next the Geometry Information dialog Window appears (this window can be also selected from the Pre-processing Menu). From this point on the program will navigate users through the entire process of entering input files. Users may either select particular commands from a menu, or allow the interface to lead them through the process of entering input data by selecting the Next button. Alternatively, clicking the Previous button will return users to the previous window. Pre- and post-processing commands and processes are also sequentially listed on the Data Tab of the Navigator Bar, Green arrows on the Edit Bar always direct users to subsequent or previous input processes for a particular command. Many commands and processes can be alternatively accessed using either the Toolbars and Menus, or the Navigator and Edit Bars.